In silico Transcriptome (iTranscriptome)
Geo-seq: 3D Transcriptome of the mouse embryo at gastrulation
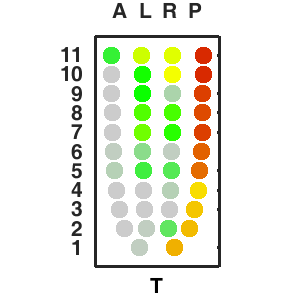
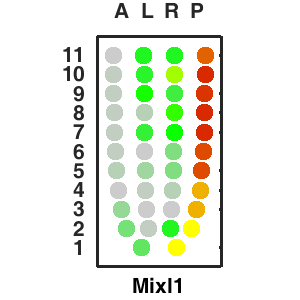
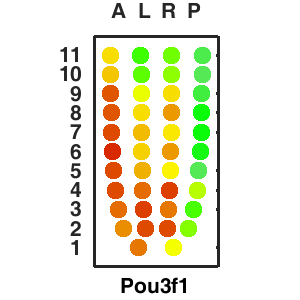
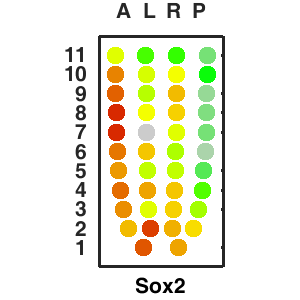
| Activity scores for this gene list shown in corn plot: |
|
| * Based on normalized activity scores across all stages (E2.5-E7.5), scaled to [0,1]. |
| Normalized activity scores across all stages (E2.5-E7.5): |
| Original activity scores in this stage: |
Key features |
| - High resolution |
- More sensitive |
| - 2D & 3D visualization |
- Searchable web service |
| |
|
Query and display the expression pattern of a query gene in either a corn plot or a 3D embryo model
Search for genes that share similar expression patterns of a query gene.
Search for genes using a query pattern (Choose one of 5 predefined patterns or input interested pattern).
Calculate the enrichment score for a query gene list based on ranked gene expression of each sample.