

In silico Transcriptome (iTranscriptome)
Geo-seq: 3D Transcriptome of the mouse embryo at gastrulation
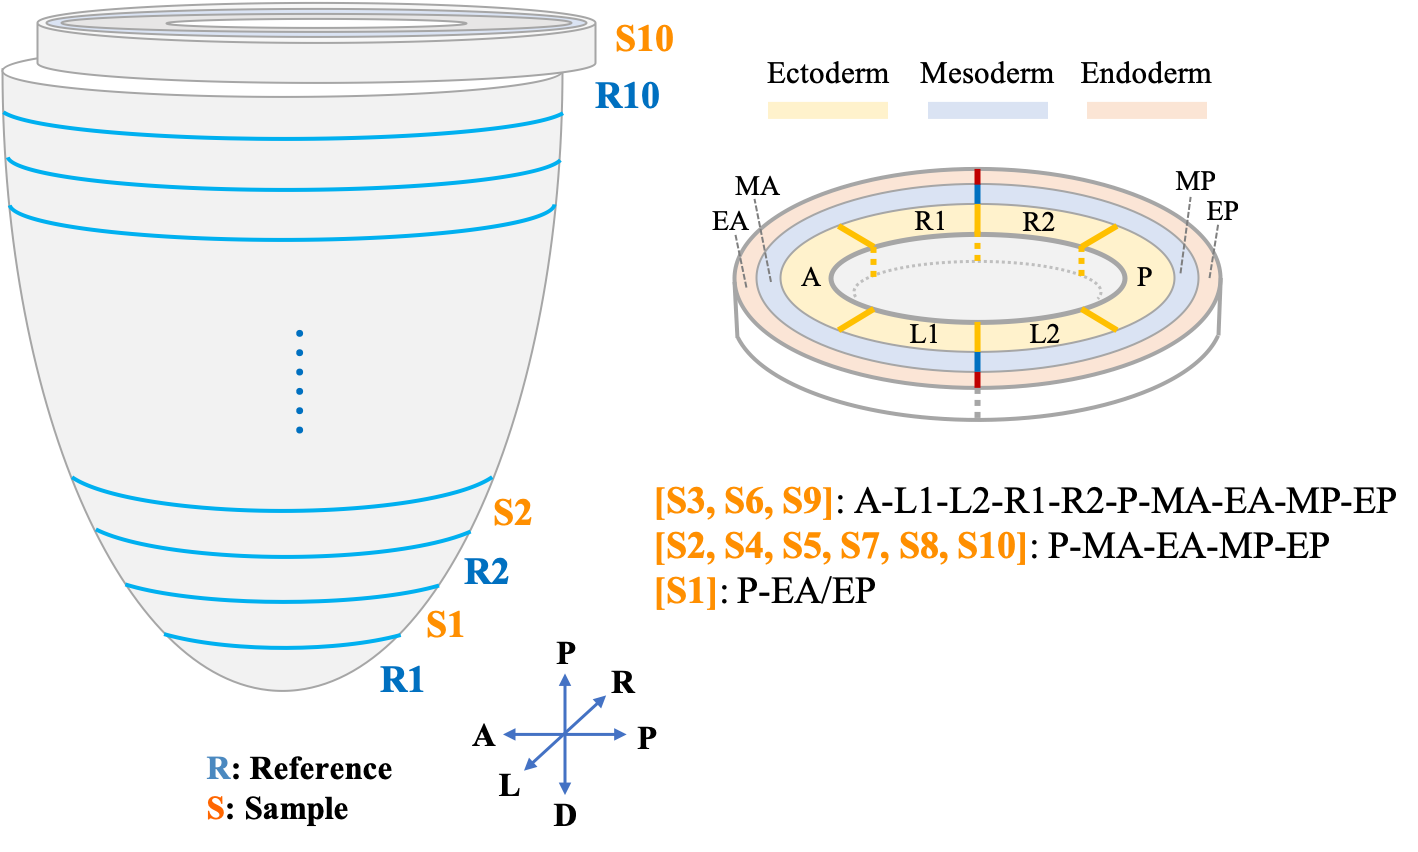
About E7.5 embryo
Sample preparation for this stage.
Features of iTranscriptome
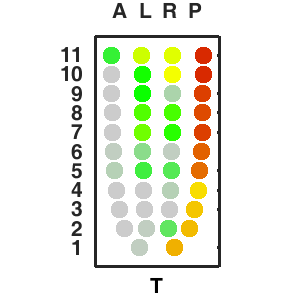
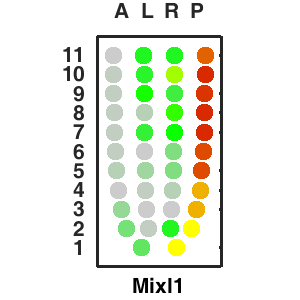
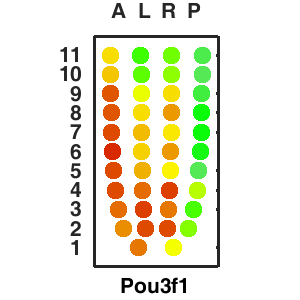
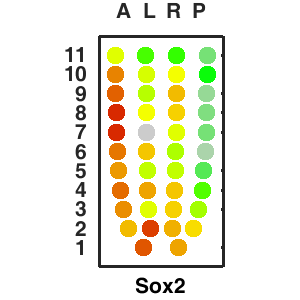
The sequencing data with spatial information cover over 20,000 genes that are expressed in the epiblast of the gastrulating mouse embryo. The data are collated into a high-resolution 3D transcriptome - the iTransctiptome. The spatially rendered gene expression data are displayed in the 2D format (the corn plot). The database can be mined to show gene's expresson pattern, identify genes showing similar spatial pattern of expression and expressing in one of the 20 stereotypic patterns depicted in the in-built templates and calculate the corraliton between all samples in reference embryo and query trancriptome data.
Citation
Guangdun Peng, Shengbao Suo, Guizhong Cui, Fang Yu, Ran Wang, Jun Chen, Shirui Chen, Zhiwen Liu, Guoyu Chen, Yun Qian, Patrick P. L. Tam, Jing-Dong J. Han & Naihe Jing. Molecular architecture of lineage allocation and tissue organization in early mouse embryo. Nature, 2019 August. 1-5.572(7770):528-532
Guangdun Peng, Shengbao Suo, Jun Chen, Weiyang Chen, Chang Liu, Fang Yu, Ran Wang, Shirui Chen, Na Sun, Guizhong Cui, Lu Song, Patrick P.L. Tam, Jing-Dong J. Han, Naihe Jing. Spatial Transcriptome for the Molecular Annotation of Lineage Fates and Cell Identity in Mid-gastrula Mouse Embryo. Developmental Cell, 2016 Mar. 36: 681-697.
Jun Chen, Shengbao Suo, Patrick PL Tam, Jing-Dong J. Han, Guangdun Peng, Naihe Jing. Spatial transcriptomic analysis of cryosectioned tissue samples with Geo-seq. Nature Protocols, 2017 Feb. 12: 566-580.
Key features |
|
| - High resolution | - More sensitive |
| - 2D & 3D visualization | - Searchable web service |