| Usages for iTranscriptome |
| |
1. Pattern search by gene (Pattern-Gene) |
|
| In this functionality, users only need to input the query gene symbol (case-insensitive). After submitting the query, this page will return the four parts of results: General information for this gene, Corn plot for this gene, 3D plot file and Original gene expression values. |
| General information displays the Gene symbol, Gene ID, Ensembl ID and Description for the query gene. |
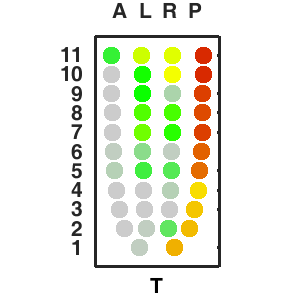
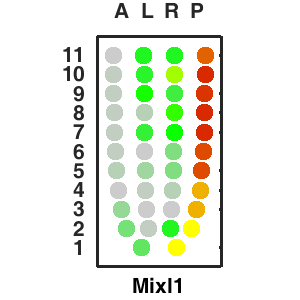
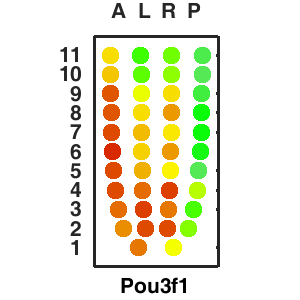
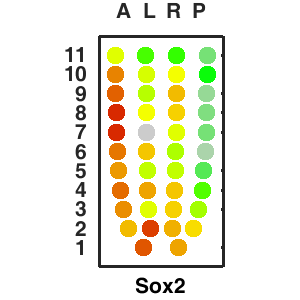
| Corn plot displays the expresson pattern for query gene, one dot represent each sample. The gene expression level is represented by color gradients. Grey hollow circles, no sample; grey circles, ectoderm; black outlined rhombus, mesoderm; black outlined circles, endoderm.. |
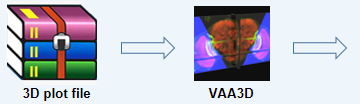
| 3D plot file for epiblast/ectoderm can be downloaded from below hyperlink for 3D reconstruction. The user also need to download the VAA3D (Hanchuan Peng, Nat Biotechnol., 2010) to perform visualization. By clicking "How to use?" can know the main steps for 3D visualization. The detailed processes are as follows: |
| Open VAA3D--File--Import--Import general image series to an image stack...--(Unzip the downloaded 3D plot file and import all images)--(Click) OK (don't need to modify any value)--Visualize--3D viewer for the entire image--(Click) Alpha--(Setting) Z-thick (as x15.0)--View and rotate the 3D modal from any angles. |
 |
 |
| Original gene expression values display the FPKM (fragment per kilobase per million) for this query gene, which are calculated by Cufflinks. The values are hided by default. User can view them by clicking the Expand/Hide hyperlink beside. |
| |
2. Gene search by gene (Gene-Gene) |
|
| This functionality is designed for users to search for genes whose expressions are co-expressed with a query gene. Guilt-By-Association (GBA) analysis (Michael G. Walker, Genome Res., 1999) is performed to identify co-expressed genes. Specifically, for all samples in one embryo, the expression values of genes are z-score normalized across all samples, and then are converted to binary matrix with the following strategy: the binary value is set to 1 if the corresponding z-scored value larger than 0, otherwise the binary value is 0. Finally, the p values for observing a given co-expression of each gene and the query gene are determined by Fisher exact test (followed with BH correction) based on 2x2 contingency table. The users need to input query gene symbol (case-insensitive) and a p value cutoff. After submiting the query, this page will dispay top 10 genes which highly co-expressed with query gene. To know the detailed information about these 10 genes, users only need to click the gene symbol, then a new page with detailed information of this gene will open. All satisfacttory genes can be downloaded from the hyperlink below. |
| |
3. Gene search by pattern (Gene-Pattern) |
|
| This functionality is designed for users to seach genes whose expreesions are similar to a certain pattern. There are 5 typical predefined expression patterns for user to fast query. To perform the match, the users first need to select one pattern or input the custom pattern in the textbox (please click the Format in this page to see how to design the pattern), and then input the cutoff value for correlation (evaluated by Spearman rank correlation coefficient, RCC). After submiting the query, a heatmap of custom pattern will be shown beside the textbox for user to view. This page will dispay top 10 genes with the highest correlation to selected pattern. To know the detailed information about thses 10 gene, users only need to click the gene symbol, then a new page with detailed information of this gene will open. All satisfacttory genes can be downloaded from the hyperlink below. |
| |
4. Gene activity score (Gene-Activity) |
|
| This functionality is designed for users to calculate the activity score based on ranked gene expression values (Sara Aibar et al. Nat. Methods, 2017). In brief, x-axis of the recovery curve is the ranking of all genes from high to low based on expression level, and the y-axis is the number of genes recovered from the tested gene set, finally area under the recovery curve is calculated to measure the activity score of this gene set. Ony the exprssed genes (FPKM>1 in at least two samples) in E2.5-E7.5 samples are selected for calculating the activity scores. The original activity score (named as A) are normalized acorss all samples from E2.5-E7.5 embryos by: (A-min(A))/(max(A)-min(A)). After inputing the gene list in textbox (One gene symbol per line) and submitting, the corn plot will be shown based on the normalized activity scores. On this page, both the normalized and original activity scores are display below the corn plot.
|
| |
| |
| |
|