In silico Transcriptome (iTranscriptome)

Geo-seq: 3D Transcriptome of the mouse embryo at gastrulation

Querying the interested expression pattern

Select one pre-defined patterns
colorbar
pattern1 pattern2 pattern3 pattern4 pattern5
OR, input an interested pattern index in the below box (~30 seconds): ( Example Clear)
The format of the input:
×
  • E5.5 stage
  • - The format of input values must contain 3 rows.
  • - The values in each row must be separated by only one white space.
  • - The columes from left to right represent En1, Epi1, Epi2, En2.
  • - The last row only need to input two value (Epi and En).
  • - The rows from up to down represent 3->1 layers
  • - The minimum is recommented as 0, and the maximun as the number of all embryo samples from this stage.
  • E6.0 stage
  • - The format of input values must contain 5 rows.
  • - The values in each row must be separated by only one white space.
  • - The columes from left to right represent EA, A, P, EP.
  • - The last row only need to input two value (AP and EAP).
  • - The rows from up to down represent 5->1 layers
  • - The minimum is recommented as 0, and the maximun as the number of all embryo samples from this stage.
  • E6.5 stage
  • - The format of input values must contain 8 rows.
  • - The values in each row must be separated by only one white space.
  • - The columes from left to right represent EA, A, P, EP.
  • - The last row only need to input two value (AP and EAP).
  • - The rows from up to down represent 8->1 layers
  • - The minimum is recommented as 0, and the maximun as the number of all embryo samples from this stage.
  • E7.0 stage
  • - The format of input values must contain 11 rows.
  • - The values in each row must be separated by only one white space.
  • - The columes from left to right represent EA, A, L, R, P, M, EP.
  • - The last row only need to input three values (EAP, A and P).
  • - The rows from up to down represent 11->1 layers
  • - The minimum is recommented as 0, and the maximun as the number of all embryo samples from this stage.
  • E7.5 stage
  • - The format of input values must contain 10 rows.
  • - The values in each row must be separated by only one white space.
  • - The columes from left to right represent EA, MA, A, L1, L2, R1, R2, P, MP, EP.
  • - The columes of row 2 and row 9 from left to right represent EA, MA, A, L, R, P, MP, EP.
  • - The top row only need to input four values (EA, MA, MP and EP).
  • - The last row only need to input three values (EAP, A and P).
  • - The rows from up to down represent 10->1 layers
  • - The minimum is recommented as 0, and the maximun as the number of all embryo samples from this stage.

Please input the cutoff for correlation analysis:


Top 10 gene with the highest corrlation to :

To download all the related data, please click here.

Key features

- High resolution - More sensitive
- 2D & 3D visualization - Searchable web service
   

E60 embryo database

Pattern search by gene
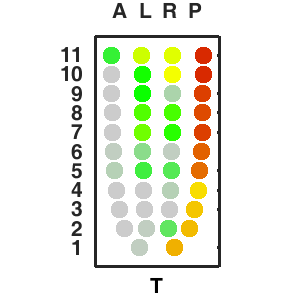
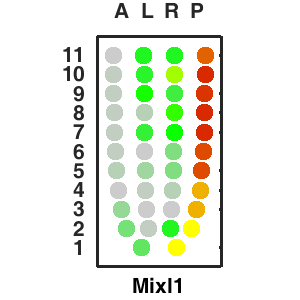
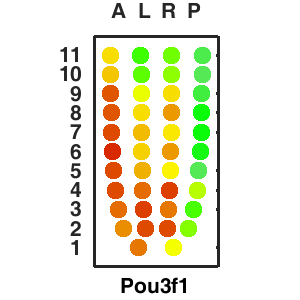
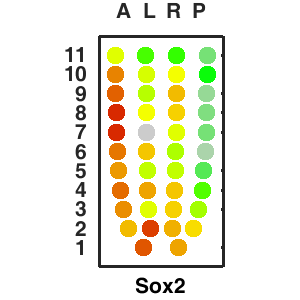
Query and display the expression pattern of a query gene in either a corn plot or a 3D embryo model
Gene search by gene
Search for genes that share similar expression patterns of a query gene.
Gene search by pattern
Search for genes using a query pattern (Choose one of 5 predefined patterns or input interested pattern).
Gene activity score
Calculate the enrichment score for a query gene list based on ranked gene expression of each sample.