eGastrulation is the 3D gene expression database of gastrulating mouse embryo (~ E5.5 - E7.5).
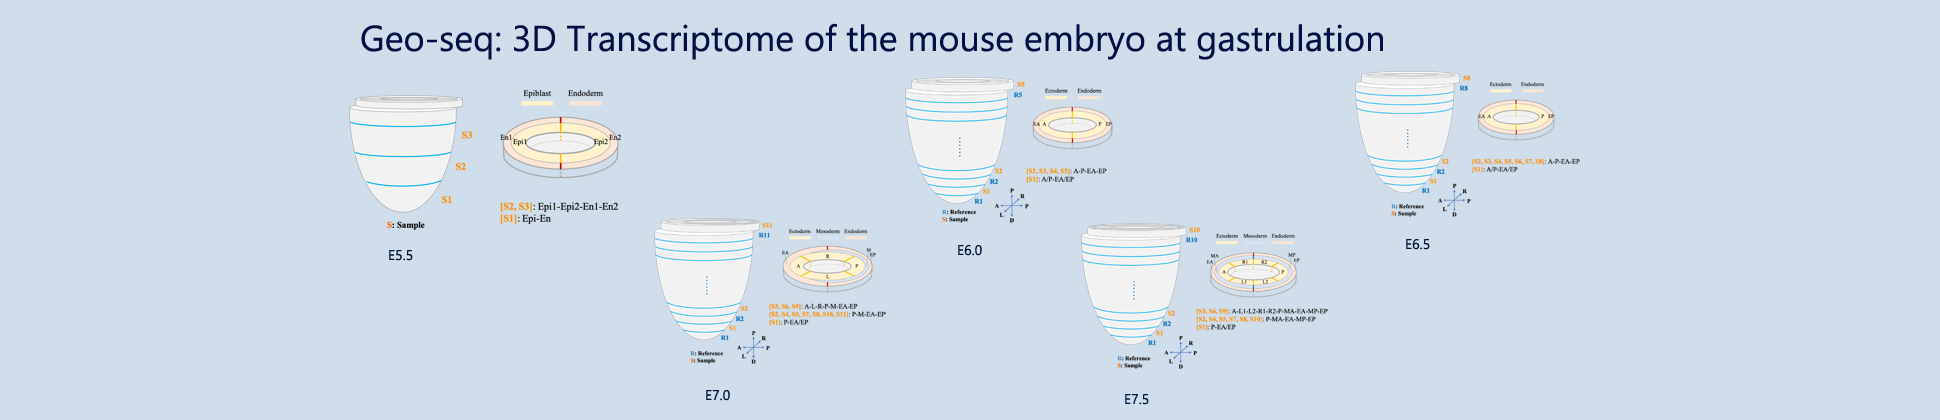
The current version of the database is built from expression data collated from one C57BL/6 embryo from the whole gastrulation. The embryo was serially cryo-sectioned in the plane transverse to the proximal-distal axis. Samples from different regions (ectoderm, mesoderm and endoderm) are collected. On each section, approximately 20 cells were isolated by laser capture microdissection from the ectoderm, mesoderm and endoderm in each of the quadrants: anterior (A), posterior (P), left lateral (L), right lateral (R), mesoderm (M) and endoderm (E). Each sample with spatial coordinate information (e.g., 3A, 4P, 5R, 6L etc with section 1 being the most distal) were collected for RNA isolation. RNA-sequencing was performed using a modified single-cell based low-input sequencing method. In addition, replicated embryos at the same developmental stage (the testers) were compared in parallel to generate data for verifying the consistency of the spatial transcriptome of the reference embryo.
Key Features
- High resolution - More sensitive
- 2D & 3D visualization - Searchable web service
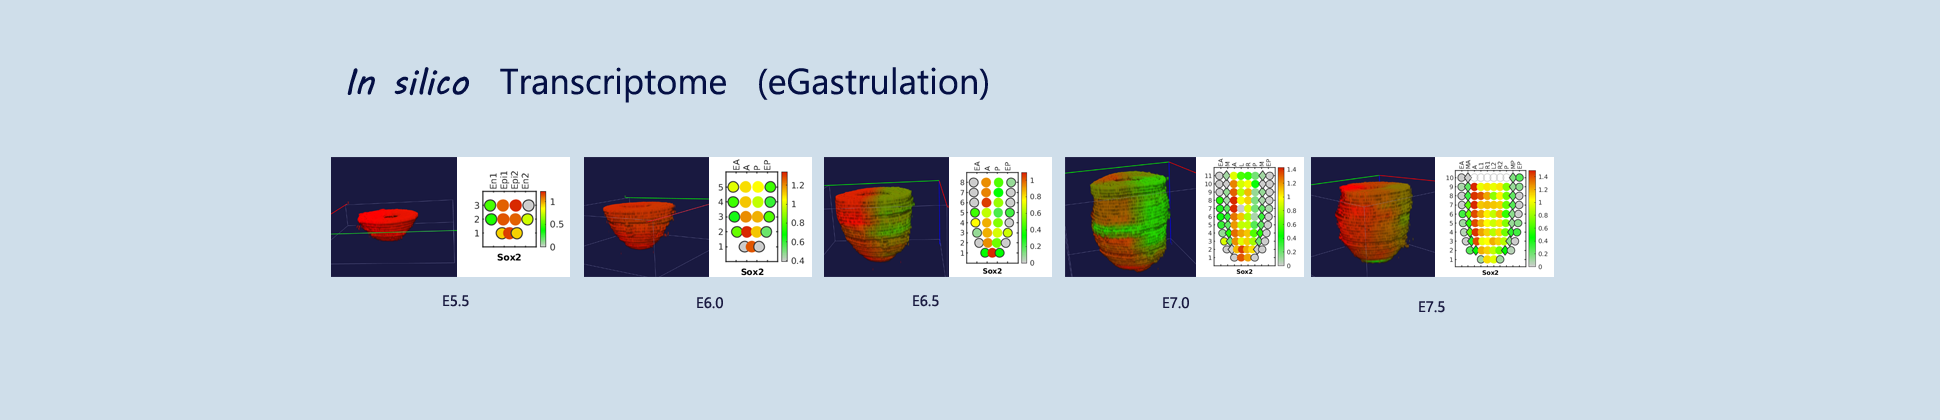
The sequencing data with spatial information cover over 20,000 genes that are expressed in the epiblast of the gastrulating mouse embryo. The data are collated into a high-resolution 3D transcriptome - the iTransctiptome. The spatially rendered gene expression data are displayed in the 2D format (the corn plot) and in the 3D format on a digital embryo template (digital whole mount in situ hybridization, d-WISH). The database can be mined to show gene's expresson pattern (Pattern search by gene/Pattern-Gene function), identify genes showing similar spatial pattern of expression (Gene search by gene/Gene-Gene function), search genes which show specific spatial patterns (Gene search by pattern/Gene-Pattern function) and calculate the enrichment score of a gene list (Gene activity score/Gene-Avtivity function).
Code for generating high resolution of corn plots (E5.5-E7.5) can be downloaded from here.
Pattern search by gene
Query and display the expression pattern of a query gene in either a corn plot or a 3D embryo model
Gene search by gene
Search for genes that share similar expression patterns of a query gene.
Gene search by pattern
Search for genes using a query pattern (There are 5 predefined patterns).
Gene activity score
Calculate the enrichment score for a query gene list based on ranked gene expression of each sample
Molecular architecture of lineage allocation and tissue organization in early mouse embryo. Nature, 2019 August. 1-5.
Guangdun Peng, Shengbao Suo, Guizhong Cui, Fang Yu, Ran Wang, Jun Chen, Shirui Chen, Zhiwen Liu, Guoyu Chen, Yun Qian, Patrick P. L. Tam, Jing-Dong J. Han & Naihe Jing
Statement
In this online published paper (Nature, 10.1038/s41586-019-1469-8), several errors in supplementary tables were inadvertently introduced during the data reorganization. In Supplementary Table 6: the order of domain labels were misplaced.
In Supplementary Table 7, the "Epi" label of E7.5 should be "Ect" for consistency with main figures. Corrected supplementary tables could be downloaded here.
Spatial transcriptomic analysis of cryosectioned tissue samples with Geo-seq. Nature Protocols, 2017 Feb. 12: 566-580.
Jun Chen, Shengbao Suo, Patrick PL Tam, Jing-Dong J. Han, Guangdun Peng, Naihe Jing.
Spatial Transcriptome for the Molecular Annotation of Lineage Fates and Cell Identity in Mid-gastrula Mouse Embryo. Developmental Cell, 2016 Mar. 36: 681-697.
Guangdun Peng, Shengbao Suo, Jun Chen, Weiyang Chen, Chang Liu, Fang Yu, Ran Wang, Shirui Chen, Na Sun, Guizhong Cui, Lu Song, Patrick P.L. Tam, Jing-Dong J. Han, Naihe Jing.